Climate Analysis
The Maproom explores historical daily precipitation by calculating simple seasonal
statistics.
The Maproom explores historical daily temperature by calculating simple seasonal statistics.
Rainfall and temperature time series reconstructed from station observations and remote
sensing proxies. This interface allows users to view rainfall, maximum, minimum and
mean temperature dekadal climatologies and anomalies.
Rainfall time series (1981-2018) and temperature time series (1981-2018) reconstructed
from station observations, remote sensing and other proxies. This interface allows
users to view rainfall, maximum, minimum and mean temperature monthly climatologies
and anomalies.
Rainfall time series (1981-2018) and temperature time series (1961-2014) reconstructed
from station observations, remote sensing and other proxies. This interface allows
users to view rainfall, maximum, minimum and mean temperature seasonal climatologies,
anomalies and probability of exceedance.
Rainfall time series (1981-2018) and temperature time series (1961-2014) reconstructed
from station observations, remote sensing and other proxies. This interface allows
users to view rainfall, maximum, minimum and mean temperature seasonal trends expressed
per year, over the selected period or percent of the average over the selected period.
The Standardized Precipitation Index is an indicator of extreme rainfall events, whether
they are drought or excess rainfall.
The Maproom facilitates the exploration of the history of extreme monthly and seasonal
rainfall characteristics.
The Maproom facilitates the exploration of the history of extreme monthly and seasonal
minimum and maximum temperatures.
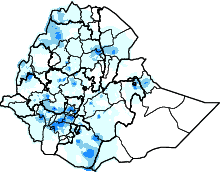
This map shows the historical probability (given in percentile) of seasonal average
monthly rainfall falling within the upper (wet), middle (normal), or bottom (dry)
one-third ("tercile") of the 1981-2016 historical distribution in the country given
the state of ENSO (El Niño, Neutral, La Niña) during that same season.
This map shows the historical probability (given in percentile) of seasonal average
monthly minimum or maximum temperature falling within the upper (hot), middle (normal),
or bottom (cold) one-third ("tercile") of the 1961-2014 historical distribution in
the country given the state of ENSO (El Niño, Neutral, La Niña) during the previous
season (e.g. Jan-Mar temperature against Oct-Dec ENSO state).
This map shows the historical probability (given in percentile) of seasonal average
monthly rainfall falling within the upper (wet), middle (normal), or bottom (dry)
one-third ("tercile") of the 1983-2010 historical distribution in Ethiopia given the
Terciles of IOD (Postive, Neutral, Negative) during that same season.
This map shows the historical probability (given in percentile) of seasonal average
monthly temperature falling within the upper (hot), middle (normal), or bottom (cold)
one-third ("tercile") of the 1983-2010 historical distribution in Ethiopia given the
Terciles of IOD (Postive, Neutral, Negative) during that same season.
Climate Monitoring
This Analysis tool allows users to view different presentations of the the most recent
dekad. The default map on this page displays dekadal (approximately 10-day) rainfall
amounts over the country. The default map shows rainfall totals for the most recently
available dekad, but totals for previous dekads can be displayed as well. By clicking
a location on the map, the user can generate four time series graphs that provide
analyses of recent rainfall averaged over an administrative district, with respect
to that of recent years and the long-term mean.
The Standardized Precipitation Index is an indicator of extreme rainfall events, whether
they are drought or excess rainfall.
The Standardized Precipitation Index is an indicator of extreme rainfall events, whether
they are drought or excess rainfall.

//var/parameter/(.precip)/eq/{.Rainfall}{.Temperature}ifelse/.dekadal/.climatologies//var/get_parameter/interp//name//clim_var/def/SOURCES/.WORLDBATH/.bath/X/33.0/48.0/RANGE/Y/3.0/15.0/RANGE/1/index/SOURCES/.Features/.Political/.Ethiopia_adm3/.Ethiopia_level3//name//Woreda/def/.the_geom/SOURCES/.Features/.Political/.Ethiopia_adm2/.Ethiopia_level2//name//Zone/def/.the_geom/SOURCES/.Features/.Political/.Ethiopia_adm1/.Ethiopia_level1//name//Region/def/.the_geom/X/Y/fig-/colors/colors/||/colors/grey/verythin/stroke/grey/thin/stroke/black/thin/stroke/-fig//antialias/true/psdef//layers[//clim_var//Region//Zone//Woreda/]psdef//plotborder/0/psdef//antialias/true/psdef//plotaxislength/220/psdef/+.gif)

//var/parameter/(.precip)/eq/{.Rainfall}{.Temperature}ifelse/.monthly//var/get_parameter/interp/T/(Jun)//seasonStart/parameter/(-)/append/(Aug)//seasonEnd/parameter/append/(%20)/append/(1981)//YearStart/parameter/append/(-)/append/(2018)//YearEnd/parameter/append/seasonalAverage//var/get_parameter/(.precip)/eq/%7B//seasonEnd/get_parameter/interp//seasonStart/get_parameter/interp/sub/dup/0/ge/%7B1/add%7D%7B13/add%7Difelse/mul/%7Dif/T/last/VALUE/SOURCES/.Features/.Political/.Ethiopia_adm1/.Ethiopia_level1/.the_geom/SOURCES/.Features/.Political/.Ethiopia_adm2/.Ethiopia_level2/.the_geom/X/Y/fig-/colors/thinnish/stroke/grey/verythin/stroke/-fig//plotborder/0/psdef//antialias/true/psdef//plotaxislength/220/psdef/+.gif)


